My paper discusses the many issues surrounding blight, the whereabouts of blight in Shelby County and why Greenspaces are the best solution for any large blighted sites, especially those within a half mile to schools.
I wanted to shed light on the amount of blight near Shelby County youth and find a way to open corridors for youth-to-nature engagement.
I hear thunder rolling far in the distance – but I love it when the sky goes dark like this. The wind is blowing in through my open window and I’m just working on ArcMaps and going through some edits on my paper.
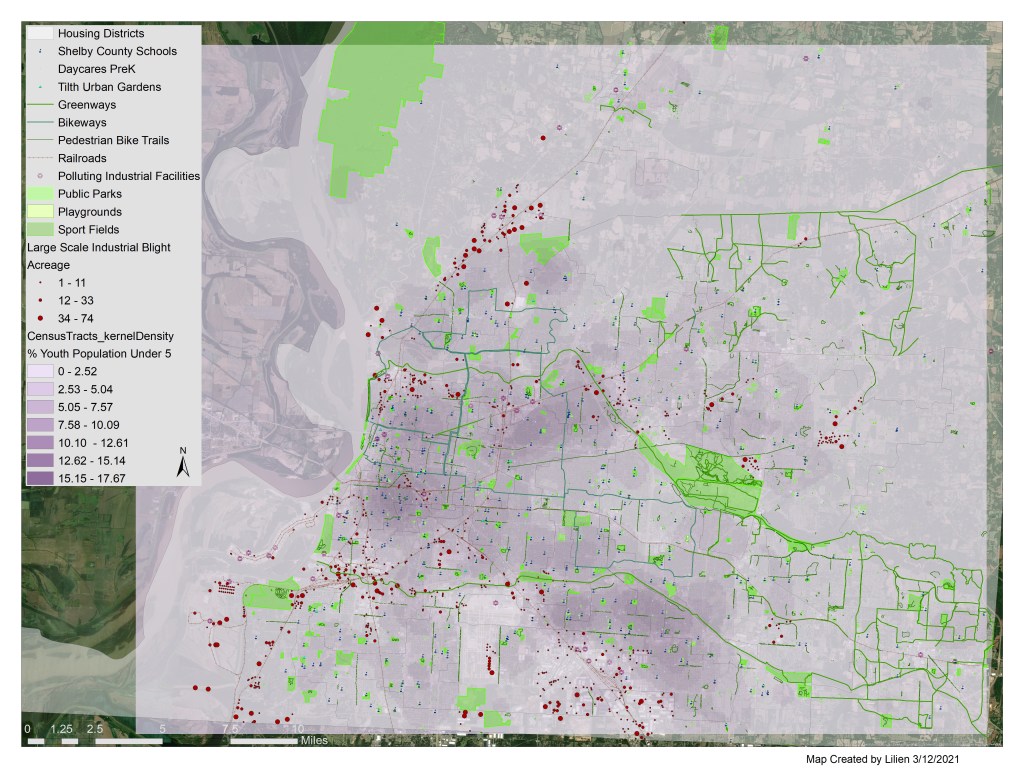
Here’s what I’d been working on.^ The only thing I don’t understand is why the Legend icons are so tiny – can’t figure out how to make them bigger. The whole map couldn’t fit into the smaller frames so this is the largest option – you should be able to zoom in to see more detail. There’s so much to learn about GIS software, it’s fun and requires a lot of meticulousness.
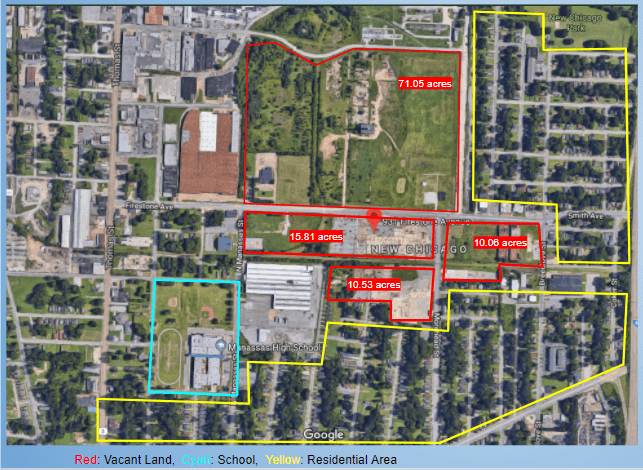
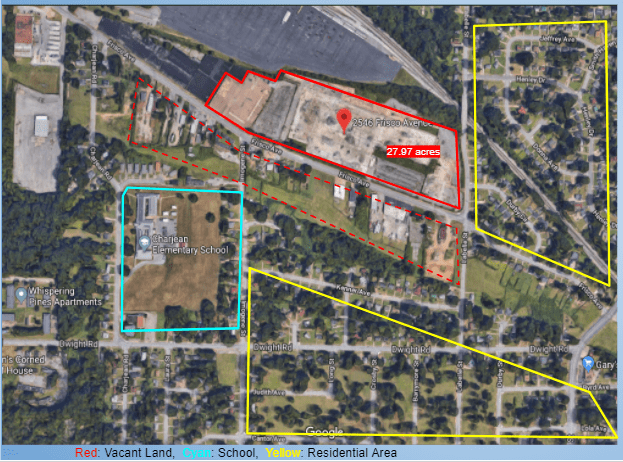
This is a map I made using data from the University of Memphis and ReGIS to assess school proximity to blight. I’ve been able to analyze these maps to figure out which schools have blight (residential, commercial or industrial) within 0.5 mile (walking distance) from their campus. The dark red dots represent large scale (1+ acre) industrial blight sites, I located by using parcel data which has Zoning codes that can be isolated in queries on ArcMaps.
All the existing bikeways, greenways and greenlines are shown as well as the different types of greenspaces available throughout Shelby County. As I look at this map I try to figure out if there’s a way any of these sites could be reused as greenspaces.. I wonder how they could be incorporated to connect more youth to existing greenlines.
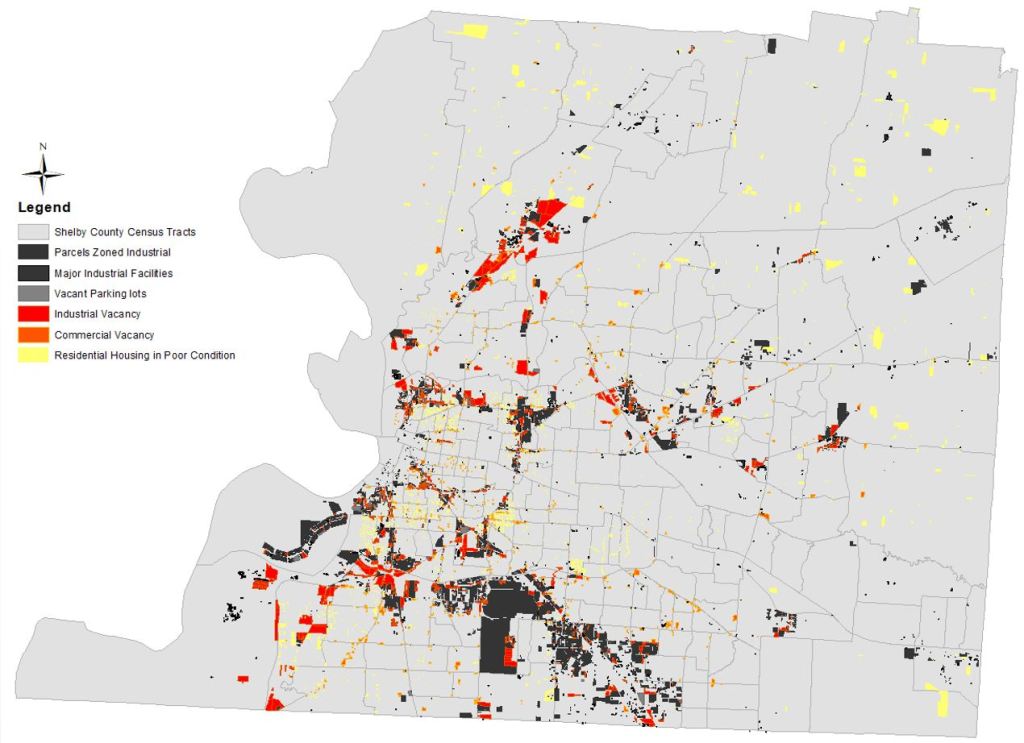
This map is missing something that any good cartographer should notice right away…. do you know? .. the scale bar. I meant to put it on the bottom right corner to show 0-10 miles. This map is also not as high resolution. But here the shapes of the actual blighted parcels are shown. It’s clear that South Memphis has the highest concentration of various forms of blight. It’s a shame because this area has so much history and was where the city began. The airport is that giant black area. All together this map represents all the industrialized land as well as the estimated amount of blight within each Census Tract across the county. According to my research, the average size of vacant industrial properties within Memphis is 6.2 acres.
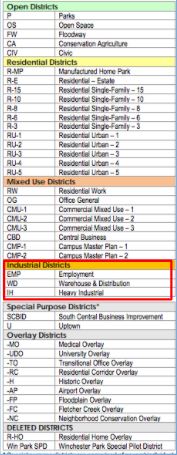
While I was able to confirm through satellite imagery that some of these large blight sites existed, I noticed while trying to isolate large-scale blight within parcel data, that there is no specific coding for blighted properties. The Land Use Coding turned out to be 0 for most blighted sites but 0 means Vacant, and vacant land isn’t always blighted. I found other sites that were blighted and had a 1, 3, 92, 93, or 95, instead of 0. I had to go through each parcel to make sure it was actually blighted. I used the Industrial codes IH, EMP, OG, WD, and then Commercial codes CMU-1, CMU-2, CMU-3, CBD, MU – which all had a 0 attached to them to get the results, I could also isolate parking lots from this data. However, there should really be a coding for land that is vacant but does contain a previously used structure vs. vacant land that is still undeveloped. The housing in poor condition was determined using 2017-18 Tax Assessor data from the Shelby County Property Assessor’s website – a girl named Clarke who assisted one of the professors I worked with helped to create that data layer. Now there is also a map by Innovate Memphis with estimated housing blight – but I worked on this Bluff City Snapshot project and their housing blight is inaccurate. It leaves out many properties and includes houses that aren’t blighted. For their survey, any house scaled as a 1-2 (out of 5) is considered blighted. Still, many properties have not been added to their database.
In my first map, I found that 328 out of a total 391 schools are in proximity to 1+ acre vacant parcels. That means 84% of schools are estimated to be a half mile from large-scale blight in Shelby County. There are over 2,100 instances of vacant parcels (according to ArcGIS online database), and my map showed that 1,070 of them are located within 1 mile to schools. There are only 226 public parks throughout the county. I did more studies including one using Centrographic Methods to display the Mean Center and Standard Deviation Ellipses for three population groups in Shelby County, TN: Black, Hispanic, White – to see how parks were serving the community.

There are 1,400 Greenspaces total (public park, playground, sportfield)
mean size = 17.84 acres
within Ellipses:
Black = 671 Greenspaces
mean size = 3.93 acres
Hispanic = 570 Greenspaces
mean size = 11.10 acres
White = 617 Greenspaces
Mean size = 9.99 acres
The map proved that certain areas are underserved, lacking larger open recreational spaces. Instead, there are blighted sites larger than the neighborhood parks. That to me is a horrible environmental injustice. –>
When located in proximity to neighborhoods and schools, larger forms of blight are unsustainable and become an environmental injustice, a misuse of land that threatens public health and safety, disproportionately to one population group. Other impacts of blight:
●Increased surface runoff / Reduced flood resilience
●Increased urban heat island effect
●Soil and groundwater contamination / Natural habitat degradation
●Eye sore / Wasted resource of space
●Attracts crime / Reflects poverty / Negative mental health outcomes
●Lowers nearby property values
●Reduces potential tax revenues / Lack of investment in surrounding community
●Dangerous, fire hazard and unsafe use of land, (Code of Ordinances, 2007)
Greening through phytoremediation is the only way to recover this land now.. since common contaminants in urban soils include pesticides, petroleum products, radon, asbestos, lead, chromated copper arsenate, and creosote. Certain plants and flowers, for example sunflowers, are good at taking toxins out of the soil. If it isn’t used as Greenspace, surely something like Mixed Use commercial buildings would be better than to leave it vacant and polluted.
According to the APA’s standards for outdoor recreation since 1965: “Every urban resident should be provided with: a small open space (<5 acres) within 1/4 mile from home, a significant (25–50 acre) open space within 1 mile from home, a large (50–250 acre) open space within 3 miles from home, and a regional (250+ acre) open space within 7 miles from home.” I don’t think that’s the case here in Shelby County.
Clearly there are barriers making it harder for blight to 1. be isolated from parcel data accurately, 2. be recorded through survey efficiently, and 3. be dealt with! It’s eating away at Memphis along the railways and into old neighborhoods… and it’s destroying the landscape for future generations, especially young students who are indeed shaped by the environments around their homes and schools.
If my maps and paper don’t take me very far or get much attention, I already have back up plans for what I’d do with my GIS knowledge. And one day after I’ve hopefully done something good to help remediate land for future generations, I’ll have my own piece of land, where I’ll grow Elderberry trees and start my own homemade Syrup small business… Ah… my dream. By then maybe I’ll have also started my own free-lance map making business, so I can help land owners or small businesses do surveys…. We’ll see what the future holds.
Anyway, it’s been a long week and Spring Break is over now. (I’ve been in school the last 9 years, wow, seems never-ending!) Lot’s on my mind! As usual!

Your research and work is brilliant! Writing about it this way makes it so much easier for the “common person” to understand. You’re doing so much good for Memphis! Wow that’s a lot of acres of industrial land! Did you see the community housing blight or whatever it all is here nearby?
LikeLiked by 1 person
Thank you so much! I’m glad, it’s helping me explain my process better too. And yes, there’s a lot to be done in Frayser too!
LikeLiked by 1 person
I’m going to check into those elderberry trees and plant one in your honor ❤️
LikeLiked by 1 person
Aww! Haha 🙂 We should start an Elderberry tree farm in Frayser!
LikeLiked by 1 person